
*Cube-Host– full cloud services!!
: Function WP_Styles::add was called incorrectly. The style with the handle "hello-elementor-child-style" was enqueued with dependencies that are not registered: hello-elementor-theme-style. Please see Debugging in WordPress for more information. (This message was added in version 6.9.1.) in /home/csrkub/domains/cube-vps.com/public_html/wp-includes/functions.php on line 6131
Notice: Function WP_Scripts::add was called incorrectly. The script with the handle "gpress-custom-js" was enqueued with dependencies that are not registered: gpress-siema. Please see Debugging in WordPress for more information. (This message was added in version 6.9.1.) in /home/csrkub/domains/cube-vps.com/public_html/wp-includes/functions.php on line 6131
*Cube-Host– full cloud services!!

3. Enter your password or use the key as configured in the panel.
Further commands are executed within this SSH session.
On a server running Debian/Ubuntu, run:
On CentOS / RHEL / AlmaLinux / Rocky:
If there are no errors, the utility is installed.
In the same SSH window, run:
After that, the screen should be completely filled with the htop interface:
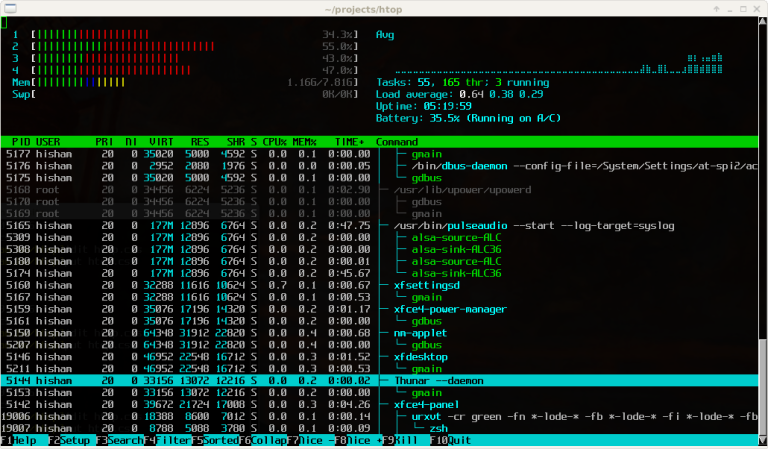
Let’s break it down from top to bottom:
To exit htop, press F10 or q.
When the CPU and memory look normal, but the server is still slow, it is worth checking the disk subsystem — read/write delays and disk load.
On Debian/Ubuntu:
On CentOS/RHEL:
Execute:
Explanation of parameters:
Example of conclusion:
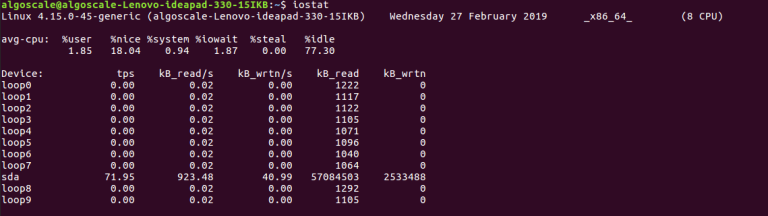
First comes the avg-cpu block, followed by the Device table with disks.
In the device table (Device row), pay attention to:
Approximate analysis algorithm:
Repeat the command iostat -x 5 3 several times during load to see how the numbers change.
atop is useful when you need to see the whole picture: CPU, memory, disks, and network in a single interface.
For Debian/Ubuntu:
For CentOS/RHEL (more often via EPEL):
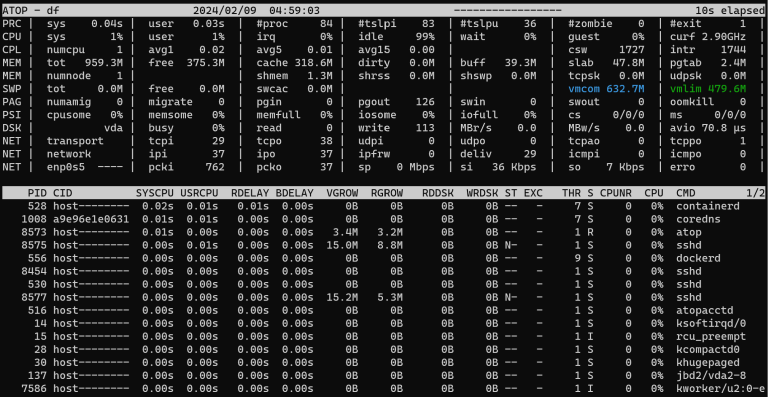
A full-screen interface will open:
The top blocks are:
Below is a list of processes with several columns: CPU, memory, disk, and network consumption.
To exit atop, press q.
To make Linux VPS load monitoring understandable and reproducible, it is convenient to follow the same algorithm:
Suspected overload
The site opens slowly, the API responds with delays, the database “freezes.”
Step 1 — htop
Step 2 — iostat
Step 3 — atop
Next
If regular monitoring shows that the server is almost always running at the limit of its CPU, memory, or disk, it is easier and more reliable to switch to a more powerful VPS plan than to constantly tweak the settings.
Monitoring the load on a Linux VPS is a sequence of specific steps:
By following the steps described and referring to the images, even a novice administrator will be able to understand what is happening with the VPS at the moment of problems and what solution — optimization or tariff upgrade — is appropriate here.

